| Reproduced from the United Nations Food and Agriculture Organization website
  
The State of Food and Agriculture 1998
WORLD REVIEW
II.
CURRENT AGRICULTURAL SITUATION – FACTS AND FIGURES
1. CROP AND LIVESTOCK
PRODUCTION
• World crop and livestock production was estimated to have increased in 1997 by
only 1.2 percent over the previous year, the lowest yearly rate of growth since 1993.
However, the slowdown occurred after a particularly bountiful crop year in 1996, when
world output had expanded by as much as 4.5 percent. The slowdown was widespread across
both developed and developing country regions.
The developing countries as a whole did not achieve any gain in per caput crop and
livestock production during 1997.
• For the developing countries as a whole, 1997 was a disappointing year for crop
and livestock production. The 1.8 percent increase recorded was the lowest since 1979 and
marked the end of five years of solid and accelerating growth, which by 1996 had reached
an estimated 5.3 percent. The recorded rate in 1997 was only just in line with population
growth. Thus, for the first time since 1987, the developing countries as a whole did not
achieve any gain in per caput crop and livestock production.
• All developing country regions shared to varying degrees in the slowdown. The
sharpest negative turnaround in agricultural performance in 1997 was recorded in the Near
East and North Africa region, where agricultural output is estimated to have declined by
close to 4 percent following a more than 9 percent expansion in 1996. Production
shortfalls in this region reflected unfavourable weather, particularly in some Northern
African countries where drought caused sharp reductions, mainly in cereal crops. However,
production is also estimated to have declined in the Islamic Republic of Iran, Iraq and
the Syrian Arab Republic.
MAP 2
CHANGES IN CROP AND LIVESTOCK PRODUCTION,
1994-1997
• In sub-Saharan Africa also, agricultural production declined by 1 percent in
1997, implying a 4 percent decline in per caput terms and interrupting a four-year period
of expansion in per caput agricultural output. Patterns of production performance in 1997
varied widely across the subregion, largely reflecting weather vagaries. Nevertheless, a
majority of 36 countries experienced falls in per caput production, with the sharpest
shortfalls occurring in southern Africa.
Although the effects of the Far East’s financial crisis may influence planting
decisions in some countries, the effects on output were not yet noticeable in 1997.
• In the Far East, agricultural output continued expanding but at a significantly
reduced rate which estimates put at a mere 2.6 percent – the lowest rate in the 1990s
and only the second time in the same period that output growth has fallen below 4 percent.
Behind the decline are lower rates of output expansion in a majority of the region’s
larger countries. In particular, China’s agricultural output growth slowed but
remained substantial, while India’s crops were hit by unfavourable weather in large
parts of the country. Countries in Southeast Asia also suffered from droughts, partly
associated with the El Ni±o phenomenon, causing a decline in agricultural production in
Indonesia and a slowdown in the rate of expansion in Myanmar, the Philippines and
Thailand. Although the effects of the region’s financial crisis may influence
planting decisions in some countries, the effects on output were not yet noticeable in
1997.• In the Latin America and Caribbean region, agricultural output growth
decelerated only marginally in 1997 to an estimated 2.9 percent. This is still slightly
above the average of the previous five years and about 1 percent above the rate of
population growth. The increase, however, was concentrated in a relatively small number of
countries (including Argentina, Brazil and Peru), while several countries in Central
America and the Caribbean, as well as Colombia and Paraguay, recorded declines in per
caput production. In Latin America and the Caribbean, as in other regions, output
shortfalls in many cases reflected the early effects of the El Ni±o phenomenon.• In
the developed countries, growth in overall agricultural output slowed to a mere 0.5
percent in 1997, following an estimated expansion of more than 3 percent in 1996. The most
pronounced turnaround was in the European Union (EU), where production contracted by
nearly 2 percent after having expanded by 4 to 5 percent the previous year. The
contraction affected most EU member countries and concerned both crop and livestock
production. Cereal production was slightly down from the record harvest of 1996, as delays
caused by rains affected wheat yields in several countries.
• In North America, agricultural output in 1997 continued expanding at an
estimated rate of 2.6 percent. While output contracted slightly in Canada for the first
time since 1992, the United States recorded an expansion of 3 percent.
• Following record output levels in 1996, agricultural production in Australia
declined by about 1 percent in 1997, while New Zealand’s overall agricultural output
continued to expand, posting an increase of 2 to 3 percent. In Japan, agricultural output
in 1997 practically remained at the level of 1996, which followed two years of decline.
Overall production levels are thus still about 7 percent below those prevailing a decade
ago.
In the transition countries, 1997 was the first year since the beginning of the
transition process in which overall agricultural production expanded, albeit by a
relatively modest 1 percent.
• Contrasting with the overall negative performances of the other regions, 1997
marked a positive turnaround for the transition countries. It was the first year since the
beginning of the transition process in which overall agricultural production expanded,
albeit by a relatively modest 1 percent. Cereal production expanded significantly
while livestock production continued its downward trend. Production increased
significantly in Ukraine and somewhat less in the Russian Federation and Kazakhstan. In
the Central and Eastern European transition countries production patterns were uneven
among countries, with Poland in particular experiencing a largely weather-induced decline
and Romania a major expansion in cereal production.
2. FOOD SHORTAGES AND EMERGENCIES
• The number of countries facing food emergencies rose from 29 in mid-1997 to 36
in mid-1998, mainly owing to the effects of the El Ni±o weather phenomenon.
• In East Africa, food supply difficulties stem from recent droughts followed by
floods in most countries, coupled with civil strife in some. In Somalia, the food supply
situation will remain extremely tight until the next harvest starting in August 1998,
after the worst floods in decades sharply reduced the 1997/98 secondary “Dyer”
crops. The floods also resulted in the loss of livestock and an outbreak of animal
diseases. In eastern Kenya, food assistance continues to be distributed to the population
affected by severe floods. In Uganda, emergency food assistance is still required for some
400 000 displaced people in the northern areas affected by continuing insurgency. In the
United Republic of Tanzania, food difficulties are being experienced in areas where the
1997/98 secondary “Vuli” crop was reduced by heavy rains and floods. In
Ethiopia, food aid is needed by more than 5 million vulnerable people, including those
affected by a poor 1997 harvest. In Eritrea, following two successive reduced cereal
harvests, the overall food supply in 1998 is tight and food prices have increased sharply
in the past months. In the Sudan, despite an overall satisfactory harvest, the food
situation is critical and assistance is required for some 2.4 million people affected by
civil strife and drought. However, distribution is hampered by insecurity and poor road
conditions. In Burundi, the food situation has deteriorated as a result of a decline in
the 1998 first-season foodcrop production and the continuing economic embargo by
neighbouring countries. The food supply situation is also tight in Rwanda owing to a
reduced 1998 first-season harvest and insecurity in western parts of the country.
• In West Africa, despite above-average 1997 harvests in coastal countries, food
supply difficulties are reported in several countries. In Liberia and Sierra Leone,
rehabilitation programmes are under way and the agricultural sector is improving, but both
countries remain heavily dependent on international food assistance. In Sierra Leone, the
poor security situation in the east is causing large population displacements and is
disrupting all agricultural activities. In the Sahel, several areas are facing localized
food supply difficulties following poor harvests in late 1997, notably in northern
Senegal, Mauritania, the Gambia and parts of Burkina Faso and the Niger.
• In central Africa, as a result of flooding, shortages of inputs and civil
unrest, crop prospects are poor in eastern parts of the Democratic Republic of the Congo.
• In southern Africa, although the impact of El Ni±o on crop production has been
relatively limited, the food supply situation in the subregion is anticipated to be
tighter during the 1998/99 marketing year than in the previous year. In Zambia, cereal
production is expected to be much below average as a result of incessant rainfall and
extensive flooding in the northern areas, while the southern part of the country
experienced near drought conditions. In Angola and Mozambique, production of food crops is
expected to improve this year, but relief assistance will be required for the internally
displaced, vulnerable people and drought- or flood-affected population.
In Asia, a combination of adverse weather conditions, the financial crisis, earthquakes
and hostilities caused food emergencies in several countries.
• In Asia, grave food supply difficulties persist in the Democratic People’s
Republic of Korea, with continued need for food aid. Severe drought in Indonesia,
attributed to El Ni±o, combined with the financial crisis, has seriously undermined the
food security of the population, resulting in the need for considerable international
assistance. In Afghanistan, the overall food supply in 1998 is anticipated to be tight as
a result of ongoing hostilities and the recent earthquake damage to the irrigation
infrastructure in the northern provinces. In Iraq, despite some improvement in the overall
food supply situation following the implementation of the “oil for food” deal,
malnutrition still remains a serious problem throughout the country. In the Lao
People’s Democratic Republic, adverse weather conditions have caused crop damage in
major rice-producing areas, exacerbating food supply problems in the country. In Mongolia,
declining agricultural production and problems of economic transition continue to have an
adverse effect on the food supply situation of vulnerable groups. Serious food supply
difficulties persist in Papua New Guinea following reduced foodcrop production as a result
of El Ni±o-related drought.
MAP 3
COUNTRIES EXPERIENCING FOOD SUPPLY SHORTFALLS
AND REQUIRING EXCEPTIONAL ASSISTANCE
• In Latin America, abnormally dry weather associated with El Ni±o has delayed
planting of the 1998/99 first-season cereal crop in Central American countries. Food
assistance is being provided in Nicaragua, Honduras, El Salvador, Guatemala and Panama and
will be needed until the harvest of the 1998 first-season crops. In the Caribbean, food
assistance distributions continue in Haiti.
• In the Commonwealth of Independent States (CIS), some 16 percent of the
population of Tajikistan is in need of targeted food aid, following widespread damage
caused by floods and landslides. Vulnerable people in Armenia (about 13 percent of the
resident population), Azerbaijan (11 percent) and Georgia (7 percent) continue to need
relief food assistance. In Eastern Europe, needy people in Bosnia-Herzegovina are
receiving food assistance.
3. WORLD CEREAL SUPPLY SITUATION AND OUTLOOK5
Global wheat output rose in 1997 to an all-time record of 615 million tonnes.
• World cereal production in 1997 reached a record 1 909 million tonnes (including
rice in milled terms), even though it increased only by a modest 1 percent, or 17 million
tonnes, from 1996. Global wheat output rose to an all-time record of 615 million tonnes, 4
percent, or 25 million tonnes, higher than the good crop of 1996. Wheat output increased
in nearly all regions with the exception of North Africa where severe drought reduced
production in several countries. By contrast, world coarse grain production in 1997 fell
by about 1 percent, or 8 million tonnes, to 911 million tonnes, although it was still
above the trend. The decline in coarse grain production was mainly on account of reduced
maize crops in China, North America and Africa, while much larger crops were harvested in
South America, Europe and the CIS. World paddy production in 1997 remained at 571 million
tonnes, unchanged from the previous year’s above-average level. Slightly higher rice
production in Australia, China, Egypt, Pakistan, Nigeria and the United States almost
entirely offset reduced output in Brazil, the Democratic Republic of Korea, Indonesia and
Myanmar.
• Global cereal stocks for crop years ending in 1998 are forecast to rise to 321
million tonnes, up by 8 percent, or 25 million tonnes, from their opening volume. Most of
this replenishment would be on account of larger wheat and coarse grain inventories,
reflecting good crops and slower growth in feed utilization, despite weaker grain prices
during the season. By contrast, global rice stocks are forecast to decline, especially in
Indonesia, the Philippines and Brazil where the 1997 outputs were adversely affected by El
Ni±o. Total cereal carryovers held by major exporters would rise for the second
consecutive year, approaching 39 percent of world total, compared with 34 percent at the
beginning of the season and only 28 percent in 1996. However, cereal stocks held by other
countries, particularly the developing countries, are likely to remain unchanged from the
previous year. Globally, the ratio of end-of-season stocks to expected utilization in
1998/99 would approach 16.9 percent, up by more than one percentage point from the
previous season and close to the 17 to 18 percent range that FAO considers the minimum
necessary to safeguard world food security.
• The prospects for the 1998/99 marketing season point to further improvement in
the global supply situation. Based on the condition of crops as of May 1998, and assuming
normal weather for the remainder of the 1998 crop seasons, world cereal production in 1998
is tentatively forecast to reach 1 911 million tonnes, slightly higher than in 1997 and a
new record. All of the anticipated increase in global cereal production would be on
account of increased coarse grain production which, at 925 million tonnes, would be 1.6
percent higher than in 1997 and above the trend for the third consecutive year. However,
wheat output is forecast to decline somewhat to 606 million tonnes, while global paddy
output is also forecast to contract slightly to 567 million tonnes, following the bumper
crops of the previous two years.
If current forecasts become a reality, cereal supplies will be sufficient to meet
expected demand in 1998/99 and allow for further replenishment of global cereal reserves.
• If current forecasts become a reality, cereal supplies will be sufficient to
meet expected demand in 1998/99 and allow for further replenishment of global cereal
reserves. Early indications suggest that cereal carryovers for the crop years ending in
1999 could rise for the third consecutive year and reach 328 million tonnes, 2 percent, or
6 million tonnes, more than their estimated opening levels. Thus, for the first time in
four years, the global stock-to-utilization ratio could return to within the 17 to 18
percent range. However, the likelihood of this forecast becoming a reality would hinge not
only on the final outcome of 1998 production but also on the eventual size of cereal
utilization during the 1998/99 season.
The forecast increase in cereal food intake in the developing countries would exceed
their population growth by a small margin and result in their per caput food consumption
rising.
• World utilization of cereals in 1998/99 is currently forecast to grow by about 1
percent to 1 904 million tonnes, which would be slightly above the long-term trend. Most
of this increase is expected to be in the developing countries, particularly as increased
food consumption is likely in those countries where most of the increase in production is
expected. This increase in cereal food intake in the developing countries would exceed
their population growth by a small margin and, hence, result in their per caput food
consumption rising slightly. By contrast, the increase in global feed use of cereals is
expected to be less pronounced despite the expected continuation of a period of weak grain
prices. Most of the anticipated expansion in cereal stocks would be in the developed
countries, especially in the major grain exporting countries, where the prospects of good
crops and slower growth in feed use could result in a further replenishment of cereal
inventories.
FIGURE 4A
SUPPLY / UTILIZATION TRENDS IN CEREALS
FIGURE 4B
CEREAL CARRYOVER STOCKS
4. EXTERNAL ASSISTANCE TO AGRICULTURE
Multilateral assistance was estimated to have declined slightly between 1995 and 1996.
• Total commitments to agriculture (broadly defined)6 made by bilateral and multilateral
donors as official development assistance (ODA) in 1996 were estimated to be $10 985
million in current prices – $297 million less than the amount recorded in
1995. The figures, however, are not immediately comparable, as the estimate for 1996 does
not include commitments in 1996 by the United States, for which data are not yet
available. In 1995 commitments from the United States amounted to $400 million; therefore,
excluding the United States, the figure for 1996 represents a slight increase of about
$100 million over 1995.
FIGURE 5
COMMITMENTS OF EXTERNAL ASSISTANCE TO
AGRICULTURE
• Measured in constant 1990 prices, total commitments in 1996 (excluding the
United States) amounted to $10 363 million, compared with $10 446 million in 1995. Thus,
commitments in real terms in 1996 remained at more or less the same level as in 1995, and
may even be slightly up when data for the United States are included. However, this can
hardly be said to represent a turnaround in the declining trend in external assistance for
agriculture during the 1990s, which brought total commitments measured in constant 1990
prices from a level of $12.2 billion in 1991 to $10.4 billion in 1995.
FIGURE 6
COMMITMENTS BY MAIN PURPOSE
• The share of concessional assistance in total commitments has been oscillating
around 70 percent throughout the 1990s, and stood at 72 percent of the total in 1996, with
the share of grants at 47 percent. Most of the bilateral assistance (indeed more than 95
percent) is in grant form, while for multilateral assistance the share of grants is only
20 percent.
FIGURE 7
COMMITMENTS BY MAIN RECIPIENT REGIONS
• In terms of bilateral commitments to agriculture, Japan remains the major donor
and alone accounted for about half of the bilateral commitments of the Development
Assistance Committee (DAC) countries in 1996. Among other DAC members, significantly
increased contributions were made by Australia, Canada and Denmark. Australia, committed
$300 million (in current prices) for the development of fisheries policies in developing
countries.
• Multilateral assistance was estimated to have declined slightly (from $10 446
million in 1995 to $10 363 million in 1996). Among the multilateral donors, commitments in
1996 from the World Bank were down some $1.2 billion (27 percent in constant 1990 prices).
The International Fund for Agricultural Development (IFAD) expanded its commitments from
$276 million in 1995 to $405 million in 1996 (an increase of 50 percent in real terms),
bringing its levels back to approximately those of 1994, following the sharp reduction of
1995. The regional development banks’ commitments also increased by $869 million to
$1 987 million, almost the same level in real terms as in 1994 after a sharp decline in
1995 similar to that recorded by IFAD.
• Provisional data for commitments by the World Bank group in 1997 indicate that
contributions from the International Bank for Reconstruction and Development (IBRD) should
be higher than in 1996 by about $1 billion, while those of the International Development
Association (IDA) would remain at the same level.
• In terms of the sectoral destination of assistance channelled to agriculture
(narrowly defined),7
commitments increased by 24 percent to $8 121 million in 1990 prices, but remained well
below the peak level of 1992. The increase affected agriculture, fisheries, forestry and
land and water development, the largest percentage increase being in the fisheries sector.
Among the broadly defined subsectors, commitments increased only towards agro-industries,
while contractions were recorded for environmental protection, rural development and, most
sharply, regional and river development.
• With regard to the geographical distribution of flows, the share of the
transition countries continued to increase and reached almost 7 percent in 1996, compared
with 5 percent in 1995. Among the developing countries, no major changes in the shares
were recorded with only a minor increase in that of Asia and a small decline for Latin
America and the Caribbean. The share of Asia is still the largest, slightly above 40
percent, followed by Africa at 23 to 24 percent, and Latin America and the Caribbean at
just below 20 percent. The share of nationally unallocated assistance, not destined to a
specific country, had been increasing and reached 16 percent in 1996.
5. FOOD AID FLOWS8
Total cereal food aid shipments in 1997/98 are estimated to have increased by about 3
percent from the previous year.
• Total cereal food aid shipments under programme, project and emergency food aid
in 1997/98 (July/June) are estimated to have reached at least 5.5 million tonnes. This
represents an increase of some 3 percent from 1996/97, mainly on account of slightly
larger shipments to low-income food-deficit countries (LIFDCs) resulting from more food
emergencies, compared with the previous year, and additional food aid provisions in
response to the Asian financial crisis. Cereal food aid shipments to LIFDCs in 1997/98 are
estimated to have risen by 3 percent from 1996/97 to about 4.6 million tonnes. Food aid
shipments of wheat in 1997/98 are estimated to reach 3.5 million tonnes, coarse grains to
increase to 1.3 million tonnes and rice shipments to reach almost 700 000 tonnes, all
three cereals together increasing by 3 percent over 1996/97.
FIGURE 8
RECIPIENTS OF SHIPMENTS OF FOOD AID IN
CEREALS
• Estimates of shipments of non-cereal food aid, i.e. largely pulses and vegetable
oils, show a further decline of about 30 percent in 1997 (January-December) to about 646
000 tonnes, compared with an estimate for 1996 of 948 000 tonnes.9 This reduction affects most regions and
also the LIFDCs. While the decline in 1997 is mostly reflected in reduced shipments of the
two largest non-cereal food aid categories mentioned above, shipments of all other food
products are also estimated to be down from the previous year.
• As of December 1997, contributions of cereals to the International Emergency
Food Reserve (IEFR), administered by the World Food Programme (WFP), expanded by almost 12
percent in 1997 (January-December) to 993 000 tonnes, from 887 000 tonnes in 1996. These
contributions are substantially above the minimum annual target of 500 000 tonnes set by
the World Food Conference in 1974. For non-cereals, the contributions fell from 225 000
tonnes in 1996 to 167 000 tonnes in 1997. Furthermore, cereal contributions to the
Protracted Refugee Operations (PROs), also administered by WFP, at 529 000 tonnes, were
marginally higher in 1997 than in 1996. The PROs’ contribution for non-cereals fell
by about 20 000 tonnes to 70 000 tonnes in 1997.
6. INTERNATIONAL AGRICULTURAL PRICES10
• Bumper grain crops in the 1997/98 season and the continuing increase in stocks
kept grain prices significantly below the previous year’s levels for most of the
1997/98 season. In the absence of any major fundamental change in international wheat
markets and given the favourable crop prospects and the seasonal harvest pressure, wheat
prices continued to decline during the second half of the 1997/98 season and by late May
1998 they were some 20 to 25 percent below the corresponding period the previous year.
Maize, barley and sorghum prices have also dropped further, falling by the end of May by
some 10 to 15 percent from the corresponding period in 1997. The decline in coarse grain
prices is partly explained by larger supplies and weaker import demand, especially from
Asia, while favourable crop prospects in all regions, with the exception of southern
Africa, have put even more downward pressure on prices since April 1998. Looking ahead to
the 1998/99 marketing season, and given the good crop prospects and a likely decline in
import demand especially for wheat, prices for nearly all types of grains are expected to
remain under pressure at least through the first half of the next season. Price
development during the second half of the 1998/99 season will depend, as usual, on
plantings and prospects for the 1999 crops, while the economic situation in Asia may also
continue to affect international grain prices until the end of the season.
• In contrast to recent developments in grain markets, international rice prices
from most origins continued on an upward trend during the months up to May 1998. As a
result, the FAO export price index for rice (1982-84), which has been rising since
December 1997, averaged 128 points in May, up from 125 points in March. The increase in
prices is attributable partly to the strengthening of the Thai baht against the US dollar
and partly to concerns about the availability of exportable supplies, especially in Viet
Nam and Pakistan, following large purchases by Indonesia and the Philippines.
• The decline in international prices of oils since the 1994/95 season came to an
end during 1997/98. The FAO price index of edible and soap fats and oils rose by about 14
percent compared with the 1996/97 season, from 135 to 154 (1990-92 = 100). The monthly
average increase in the weighted prices of all types of oils and fats between August 1997
and May 1998 was about 2.5 percent, reflecting the tight market conditions for the
commodities concerned, but especially for soft oils, for which the price increase was even
steeper.
• At the same time, the rise in international prices of oilmeals since the 1994/95
season also terminated during 1997/98, and the FAO price index of oilcakes and oilmeals
fell by about 7 percent in 1997/98 compared with the previous season, triggered by
abundant supplies of the commodities concerned entering the market.
Oilseed production appears to have maintained its economic viability over other
agricultural products.
• The divergent movement of prices, i.e. the increase in international prices of
oils and the decrease in international prices of meals, coupled with other changes in
market fundamentals, resulted in a 2.5 percent decline in international prices of
oilseeds, as reflected by the FAO price index of oilseeds, over the same period. Despite
this, oilseeds appear to have maintained their economic viability in production over other
agricultural products and early indications are that global oilseed production will expand
again in 1998/99. As a result, the downward pressure on the prices of oilseeds, oilcakes
and oilmeals could continue well into the next season, while the upsurge in the prices of
oils and fats could level off.
• World cocoa prices steadily increased during 1997, with an International Cocoa
Organization (ICCO) average monthly price reaching 78 US cents per pound in December 1997,
11 US cents higher than in December 1996. In January 1997, the average monthly ICCO price
was 65 US cents per pound. This corresponded with the end of a cycle of downward price
movements from 1996 as large shipments from C¶te d’Ivoire kept pressure on prices
despite general expectations of a global deficit in supply. In March 1997, an upward trend
in prices began as concerns over a continuing structural deficit in the global cocoa
market resurfaced and weather-related concerns over crops in Indonesia emerged. In
September 1997, the average ICCO price peaked at a ten-year high of 80 US cents per pound,
and this was also underpinned by increased purchases by market speculators and grinders as
a reaction to the El Ni±o phenomenon. In the last quarter of 1997, when an analysis of
the El Ni±o impact became available and market concerns dissipated, prices began to
stabilize. In December 1997, the average monthly ICCO price closed the year at 78 US
cents. In the first quarter of 1998, prices fluctuated within the 75 to 80 US cents per
pound range. The average 1997 ICCO monthly price was 73 US cents per pound, compared with
the ICCO 1996 average of 66 US cents, representing an annual average increase of 8 US
cents per pound, or 12 percent.
The peak of the market for coffee was reached in May 1997 when the ICA composite price
reached 180 US cents per pound, its highest level since 1986.
• World coffee prices rose dramatically during 1997, with the International Coffee
Agreement (ICA) composite price increasing from 100 US cents per pound in January 1997 to
130 US cents per pound by December 1997, an increase of 30 percent. The peak of the market
was reached in May 1997 when the ICA composite price reached 180 US cents per pound, its
highest level since 1986. Unlike previous dramatic price increases in 1986 and 1995, which
were caused by frosts in Brazil, the price increase of 1997 was driven by strong demand
and tightness of supply of arabica coffee, particularly Colombian and other milds.
Reflecting this tightness, the price of arabica coffee beans rose by over 100 percent
between January 1997 and May 1997, compared with only 39 percent for robusta. As a result,
the price differential between the arabica and robusta varieties increased by more than
three times during this period. From its May 1997 peak, the composite price began to fall
as production and exports were able to satisfy consumption needs. By December 1997, the
price had fallen to 130 US cents per pound and remained near this level in the first
quarter of 1998. It has since begun to fall again as crop prospects for the 1998 season
appear favourable, particularly in Brazil where a very large crop is anticipated.
The Asian financial crisis and reduced imports from several major importing countries
such as China have weakened the cotton market.
• World cotton prices, as indicated by Cotlook A-Index, have trended downwards
since July 1997, from 81.3 US cents per pound in July 1997 to 63.9 US cents per pound in
May 1998 (average for the first three weeks). The weaker market has been largely due to
the Asian financial crisis and the reduction in imports from several major importing
countries such as China. World production in 1997/98 (the marketing year begins on 1
August) is expected to be at the same level as that in 1996/97. Consumption, however, is
expected to be lower than last year largely owing to a significant decline in consumption
in several Southeast Asian countries. Thus, by the end of 1997/98, world stocks are
expected to be slightly higher than at the same time the previous year. World trade is
expected to contract by about 6 percent in 1997/98. Imports by China, Southeast Asia and
the Republic of Korea are expected to decrease by 45, 20 and 21 percent, respectively,
from their 1996/97 levels. Consequently, most exporting countries could expect to see
their exports slightly lower than in 1996/97. Cotton prices are likely to continue to be
under downward pressure in the near future because of the ongoing competition from
synthetic fibres and weaker import demand owing to the financial crisis in Southeast Asia.
FIGURE 9
EXPORT PRICE INDEX FOR FOODSTUFFS
World sugar trade is expected to decline by nearly 3 percent in 1997/98.
• World sugar prices were relatively stable in 1997. The 1997 International Sugar
Agreement (ISA) average price was 11.37 US cents per pound, compared with the 1996 ISA
average price of 11.96 US cents per pound. The ISA price rose marginally throughout 1997
to reach 12.33 US cents per pound in the last quarter. The revised FAO estimate of world
sugar production for 1997/98 is 123.6 million tonnes raw value, representing a marginal
increase of about 100 000 tonnes over the previous year’s output. The share of cane
sugar remained substantially unchanged at about 70 percent of the total, or 85.6 million
tonnes, compared with an output of 38 million tonnes of sugar from beet. World sugar
consumption in 1998 is forecast by FAO to reach 123.1 million tonnes raw value, an
increase of 1.6 percent compared with 1997. This represents a decline from the average
growth rate in recent years of 2.5 percent, mainly owing to the economic downturn in Asia.
World sugar trade is expected to decline by nearly 3 percent in 1997/98 with gross import
demand amounting to 33.5 million tonnes compared with 34.5 million tonnes the previous
year. World sugar stocks are expected to remain ample at more than 45 million tonnes, or
36 percent of consumption. In the first quarter of 1998, world sugar prices again began to
decline, weakening to 9.77 US cents per pound in April 1998. This was attributed in part
to lower global import requirements, in particular from Southeast Asia owing to the
financial turmoil, from the Russian Federation owing to stock carryover in 1997, from
China owing to increased internal production, and from India owing to increased internal
production and the drawdown of stocks. Considering that sugar from the new crop in the
Southern Hemisphere will soon be on the market, a substantial recovery in prices is not
likely to take place in the short term.
FIGURE10
EXPORT PRICES OF SELECTED COMMODITES,
1994-1998
World market prices of tea continued their upward trend in 1997, averaging 25 percent
more than in 1996.
• World market prices of tea continued their upward trend in 1997, averaging $2
215 per tonne on the London market, 25 percent higher than in 1996, mainly owing to a
further improvement in demand in the Russian Federation and CIS countries, and
drought-reduced output in Kenya. Prices continued to be strong at the beginning of 1998,
reaching $3 118 per tonne in January. After initial 1998 reports indicated that production
in major exporting countries such as Sri Lanka, Kenya and India was significantly above
the previous year’s level, tea prices declined rapidly to $2 049 and $1 760 per tonne
in April and May 1998, respectively, and rose slightly in June. There is a strong
indication that for the remainder of 1998 the downward pressure on prices might continue
given the slow growth in demand and the strong supply available in exporting countries.
7. FISHERIES: PRODUCTION, DISPOSITION AND TRADE
• Production of fish, shellfish and other aquatic animals reached a record level
of 121 million tonnes in 1996, an increase of 3.2 percent over 1995. Capture fisheries, at
94.6 million tonnes, increased by 1.7 percent and contributed 78 percent of the total
volume. The remaining 22 percent was contributed by aquaculture production, which at 26.4
million tonnes recorded an increase of 8.2 percent over 1995. In addition, 9 million
tonnes of aquatic plants (wet weight) were harvested, nearly 90 percent of which came from
aquaculture production.
• Inland capture fisheries increased globally by 2.3 percent to 7.6 million
tonnes; the increase occurred entirely in Asia while decreases were recorded in Africa,
South America and Europe.
• Global catches from marine waters increased by 1.7 percent in volume for an
estimated value of some $80 billion. This was as a result of higher landings from the
Northwest Pacific – which accounts for nearly 30 percent of total marine capture
fisheries – and, to a lesser extent, from the Eastern Central Atlantic and the Indian
Ocean. These increases more than compensated for the lower landings reported for fisheries
from some other marine areas, such as the Mediterranean and the Black Sea (where landings
declined by 11 percent), the Western Central Pacific (a decline of 2 percent) and the
Northeast Pacific (a decline of 5 percent). Small pelagic species, which represent 40
percent of the volume of specified captures, increased by nearly 3 percent to 39 million
tonnes. Demersal fish, at 18 million tonnes, remained at the same level as in 1995, while
salmons and tunas decreased by 10 percent and 2 percent, respectively. Increases relative
to 1996 were also recorded for captures of shrimps and prawns (8 percent), crabs (4
percent) and cephalopods (6 percent), while production of molluscs decreased by 13
percent.
FIGURE 11
WORLD FISH CATCH AND SUPPLY
FIGURE 12
TRADE IN FISHERY PRODUCTS
Output from aquaculture continued to expand at a faster rate than from any other food
production sector.
• Output from aquaculture continued to expand at a faster rate than from any other
food production sector. Between 1986 and 1996, global aquaculture production increased at
an average annual rate of 10 percent in terms of both quantity and value, and in 1996 the
value of total world output from the sector reached $46.6 billion (aquatic plants
included). Asia, and in particular China, continues to dominate world production, and in
1996 Asia accounted for 91 and 83.5 percent of production in terms of volume and value,
respectively. In contrast, Africa accounted for only 0.3 percent of volume and 0.6 percent
of value, although since 1990 output in this continent has been increasing at an average
annual rate of 5.4 percent.
• Total fisheries exports amounted to $52.5 billion in 1996, virtually the same
level as in 1995. Trade volumes increased, but as prices were lower for the most important
fisheries commodities, the change in global value was insignificant. In value terms, just
below half of total exports in 1996 originated from developing countries, compared with a
share of 51 percent in 1995. Within this amount 36 percent was attributable to LIFDCs,
compared with 39 percent the previous year. For many developing nations fisheries exports
constitute a significant source of foreign currency earnings, with total net developing
country receipts from fishery trade representing $16.6 billion in 1996, more than three
times the total for 1986
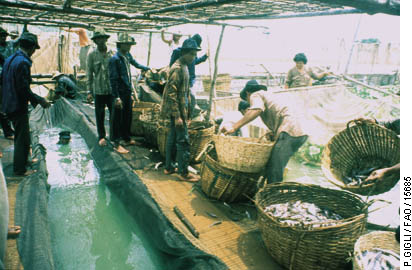
PICTURE 3
Export-oriented aquaculture activities on the
Tonle Sap River in Cambodia
Aquaculture is the fastest-growing food production sector.
• Twenty-two countries account for 75 percent of exports of fish and fisheries
products in value, and the first 11 countries account for as much as 51 percent of the
total. With export earnings of $4.1 billion in 1996 (9 percent of the world total),
Thailand maintained its position, which it has held since 1993, as the leading world
fisheries exporter, in spite of a 7.5 percent decrease compared with 1995. The second
largest exporter, Norway, with total exports of $3.4 billion, increased its export value
by 10 percent over 1995, while the third largest exporter, the United States, saw its
exports decline by 7 percent to $3.1 billion. However, the United States is also the
second largest importer of seafood products, with imports exceding exports by $4 billion.
Exports from mainland China amounted to $2.9 billion, showing no change compared with
1995, and those from Taiwan Province of China to $1.8 billion, preceded by Denmark and
Canada showing exports of $2.7 and $2.3 billion, respectively.
Industrialized countries accounted for more than 80 percent of the value of fisheries
imports, and Japan alone for nearly 30 percent of the world total.
• The destination of most of the fisheries exports is the developed economies.
Industrialized countries accounted for more than 80 percent of the value of imports, and
Japan alone (with $17 billion of imports) for nearly 30 percent of the world total. The
United States was the second largest importer, with imports of $7 billion, followed by
France and Spain with just over $3 billion each. In 1996, however, all the three largest
importers recorded declining imports relative to 1995. Developing country imports grew by
7.5 percent to more than $9 billion, corresponding to 16 percent of the world total,
one-fourth of which was imported by the LIFDCs. Some of these imports, however, were
composed of fishmeal for poultry, and aquaculture feed for the production of high-value
species for export.
• The major part of world fish and shellfish production (75 percent in 1996) is
destined for direct human consumption and reaches consumers in a variety of end uses,
mainly as fresh or chilled products. In recent years, in parallel with the upsurge of
world aquaculture production, the importance of fishery products marketed fresh has
increased in both absolute and relative terms. Indeed, in 1996 one-third of global
production was marketed as fresh/chilled with volumes nearly 70 percent higher than ten
years earlier. As a result of increased fishery production and unchanged levels of its
reduction to meal, world fish availability for food increased from 15.2 kg per caput in
1995 to 15.7 kg in 1996.
• Early estimates for 1997 point to a lower level of fish production, mainly owing
to lower catches of small pelagic species in South America as a consequence of the El
Ni±o phenomenon. Since such species are largely used in the feed industry, it is likely
that the availability of fish for food has remained unaffected.
8. PRODUCTION AND TRADE OF FOREST PRODUCTS
In 1997, there was a general increase in output for all forest products.
• In 1997, world roundwood production increased by 1.6 percent to reach 3 410
million m3. In the developing countries, which account for about two-thirds of
the total (64 percent in 1997), roundwood production increased by 2.3 percent, while in
the developed countries output growth was limited to a modest 0.5 percent. Industrial
roundwood production (which excludes fuelwood and accounts for 45 percent of the total) in
its turn increased by 1.9 percent to 1 520 million m3. The developed countries
are responsible for the larger share of industrial roundwood (70 percent) and expanded
production by 2.2 percent to 1 060 million m3, with developing country
production increasing by a more limited 1.5 percent to 460 million m3.
• Global production of solid wood products (sawnwood and sleepers and wood-based
panels) showed an increase in 1997, with production of sawnwood and sleepers estimated to
have increased by 2.3 percent to 439 million m3, and that of wood-based panels
by 2-3 percent to 153 million m3. The bulk of this expansion again occurred in
the developed countries, which account for more than two-thirds of the total output of
these products.
A predicted decline in Asian 1998 consumption is likely to depress world demand
for pulp and paper products and lead to reduced prices.
• There was also a significant growth in world output of pulp and paper
products in 1997, following the small decline experienced by the sector in 1996.
Production of paper and paperboard increased by 6.3 percent. The strongest growth was
recorded in the developed countries, at 6.8 percent, particularly in Western Europe where
paper production went up by 8.5 percent, followed by the United States with an expansion
of 5.2 percent, Japan with 3.3 percent and Canada with 3 percent. These producers account
for some 75 percent of world paper production. The situation was less favourable in the
developing countries, where the past strong growth of some major Asian producers slowed
down considerably. As with paper products, production of wood pulp also grew considerably,
at a rate of 5.7 percent, with international prices slowly recovering after the sharp fall
experienced in 1996. Wood pulp inventories decreased from the 1996 high of 2.5 million
tonnes to 1.6 million tonnes, which is considered to be closer to a balanced market.
Because of the Asian financial crisis, analysts have predicted a decline in 1998 in Asian
consumption, which is likely to depress world demand for pulp and paper products and lead
to reduced prices.
• Markets for other forest products were particularly favourable in Europe, where
demand strengthened and consumption of nearly all forest products rose. However, because
of highly competitive markets, European prices of wood products showed no increase in
1997. In North America, demand was favourable for most of 1997. In Canada, housing starts,
the main economic indicator for the mechanical wood industry, increased by some 20
percent. In the United States, however, because of strongly reduced log prices caused by
the diminished demand in Asian markets, domestic prices of sawnwood fell sharply in the
second part of the year. Japan experienced a serious decline in starts of wooden houses in
1997, down by some 20 percent, reflecting the poor performance of its economy. This
resulted in a marked reduction in its imports of processed wood products, both tropical
and temperate, which had grown steadily in previous years.
• Prices for most forest tropical wood products such as logs, sawnwood and plywood
decreased considerably in 1997, reflecting the weak demand of major Asian importers. The
log exporters of Papua New Guinea and the Solomon Islands are reported to have experienced
the worst market conditions in a decade. On the other hand, international prices for wood
pulp and paper products rose marginally above the depressed levels of 1996.
FIGURE 13
MAIN FOREST PRODUCTS
• As a result of increased prices for pulp and paper products, 1997 saw an
estimated increase of 2.2 percent in the total value of exports of forest products. The
increase was confined to the developed countries, which are the major producers and
traders in pulp and paper products. On the other hand, the depressed prices of tropical
wood products resulted in a 5 percent decline in developing country forestry exports and
in a diminished weight of the developing countries in the total value of trade in forest
products, with their share declining from 18 percent in 1996 to an estimated 16.5 percent
in 1997.
|